WHAT ARE THE HEIKIN ASHI CANDLES AND DO I GET FROM HEIKIN ASHI MOVING AVERAGE INDICATOR DOWNLOAD?
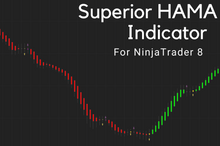
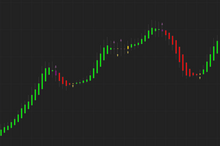
The Heikin Ashi Moving Average (HAMA) plots a completely new set of bars over a certain period. The bars are classified in to two types: Uptrend and Downtrend.
With the Heikin Ashi Candles you can clearly see the trend shift, from which you can decide if you should buy or sell. You can control how the bars are created by using one of top 9 MA types. The Heikin Ashi Indicator is a must-have indicator for everyone trading with NinjaTrader - no matter whether one is a pro or a novice.
The Heikin Ashi candles are created by using a modified formula of close-open-high-low (COHL) based on two period moving averages.
The Heikin Ashi Moving Average (HAMA) is one of our favorite trend indicators and therefore listed in our best market trading indicators.
HEIKIN ASHIN INDICATOR DOWNLOAD FOR NINJATRADER
Download the Heikin Ashi Indicator by Devside Trading for NinjaTrader 8 today!
Features:
-
✅ Plot HAMA Candles
-
✅ For futures, forex & equities trading
-
✅ Fitting experienced & new traders
-
✅ Fully compatible with NinjaTrader 8
-
✅ Arrow markers on trend shift
-
✅ Trend signals for the following states: Uptrend = 1, Downtrend = -1
-
✅ Sound Alerts: Set sound alerts for trend changes
-
✅ Email Alerts: Receive alerts via Mail for trend changes
-
✅ PopUp Alerts: Display alerts as popup window for trend changes
-
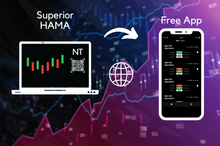
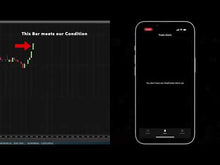
✅ Push Alerts: Receive alerts for trend changes directly on your phone with our free Trado Alerts app available on the App Store and Play Store.
-
✅ Plot smoothing: Select from 1 of top 9 moving averages to smooth the HAMA bars calculation
-
✅ Bar coloring: Enables bar coloring for different trend states
By validating the Heikin Ashi strategy, it can help guide you to stay longer in a trade or wait a bit longer before entering at the beginning of a potential trend.

USE THE HEIKIN ASHI IN YOUR STRATEGY NOW FOR YOUR BENEFITS AND ANALYZE THE LATEST PRIZE TRENDS
The Heikin Ashi Moving Average (HAMA) is a great Trend Indicator for the big events, since it filters out small trend changes and most of the market noise and signals the trader when to buy or to sell. The Heikin Ashi trading strategy was created by Munehisa Homma in the 1700s and it plots smooth price activity by calculating the average values.
Furthermore, the Heikin Ashi Indicator makes the strength of trends visible using candle size, wicks and shadows to make the next trend change signal easier to see.
On traditional candlestick charts you have frequently changing candles, whereas the Heikin Ashi candlestick chart has more consecutive colored candles. This gives the candle chart a smoother appearance, which filters out small changes in the market. Our Heikin Ashi Indicator can be used for forex trading, as well as trading with futures and equities.
With the Download of Heikin Ashi Indicator you get an indicator that shows trend directions and changes.
CHECK OUT OUR OTHER USEFUL TREND INDICATORS FOR NINJATRADER AND MORE!
With the HAMA Indicator download you are using one of the most reliable techincal analysis tool, but be sure to check out our other trend indicators:
The highest high and lowest low of the previous n periods are used to calculate the Donchain Channel, which represents the Fibonacci Zone Superior Indicator. The high and low borderlines are included in the plot's four fibonacci sequence lines. In addition, three of the following five zones had oblique coloring. Fibonacci zones can serve as both resistance and support.
A well-known technical price indicator is the Bollinger Bands. The three-line Bollinger Bands indicator provides a distinctive viewpoint on price and volatility. This indicator is made up of the upper and lower bands on either side of the Simple Moving Average (SMA). Two standard deviations from the market's SMA are represented by each range. It is possible to find areas of support and resistance using the Bollinger method.
DEVSIDE TRADING: DOWNLOAD THE HEIKIN ASHI INDICATOR FOR NINJATRADER AND MORE!
To download the Heikin Ashi Moving Average and get all benefits such as alerts and trend changes, add the indicator to your cart. After providing the needed information at the check-out you can choose one of our various, safe payment methods.
Next, we will send you a confirmation message via email with an activation code, so you can safely download the Heikin Ashi Candles Indicator. Interested? Often used in combination with our Ichimoku Cloud Superior and FREE Stochastic Momentum Index.
Need Help activating your purchased downloads or using Heikin Ashi Candles Indicator with our App? Check out our helpful guide about activating your product! Want more?
We also have an exciting NinjaTrader App and e-mail share service. Of course, your personal details will only be collected if you freely disclose them to us, e.g. while ordering an indicator, opening a membership account or subscribing to our newsletter.
Any questions left? Feel free to contact us using our contact form or you can chat with us directly!
Made in Germany


