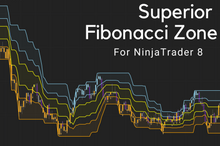
WHAT IS FIBONACCI ZONE SUPERIOR INDICATOR AND WHAT BENEFITS DO I GET FROM THE FIBONACCI ZONE SUPERIOR INDICATOR DOWNLOAD?
The Fibonacci time zones are a time-based technical indicator. The Fibonacci Zone Indicator is often activated on the chart during a large swing high or swing low. Vertical lines then extend to the right, suggesting time periods that may result in another large swing high, low, or reversal. These vertical lines are based on Fibonacci numbers and correlate to time on the x-axis of a price chart.
It is not recommended to utilize the indication alone. Add it to price action and trend analysis, other technical indicators, and/or fundamental analysis.
FIBONACCI ZONE SUPERIOR INDICATOR DOWNLOAD FOR NINJATRADER
Download the Fibonacci Zone Superior Indicator by Devside Trading for NinjaTrader 8 today!
✅ Features
-
✅ Based on proven technical analysis of charts
-
✅ Show trend reversals
-
✅ Suitable for all types of traders and investors
-
✅ Easily set up
-
✅ Full customization including colours
-
✅ Fully compatible with NinjaTrader 8
-
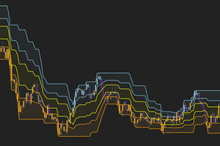
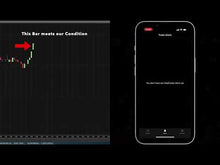
✅ Drawing arrow marker when the price crosses one of the Support or Resistance lines
-
✅ Cross Region signals for the following states:
-
Price above High Line Border = -3
-
Price above High Fibonacci Line = 2
-
Price above Center High Fibonacci Line = 1
-
Price above Center Low Fibonacci Line = 0
-
Price below Center Low Fibonacci Line = -1
-
Price below Low Fibonacci Line = -2
-
Price below Low Line Border = -3
-
-
✅ Sound Alerts : Set sound alerts for upper cross, lower cross, inside cross
-
✅ Email Alerts : Receive alerts via Mail for upper cross, lower cross, inside cross
-
✅ PopUp Alerts : Display alerts as popup window for upper cross, lower cross, inside cross
-
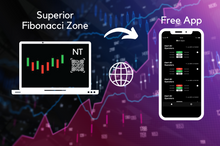
✅ Push Alerts : Receive alerts for upper cross, lower cross and inside cross directly on your phone with our free Trado Alerts app available on the App Store and Play Store .
-
✅ Plot smoothing: Select from 1 of top 9 moving averages for smoothing of the High and Low series
-
✅ Bar coloring: Enables bar coloring for down and up trends

USE THE FIBONACCI ZONE SUPERIOR INDICATOR IN YOUR STRATEGY NOW FOR YOUR BENEFITS AND ANALYZE THE LATEST PRIZE TRENDS!
With the Fibonacci Zone Superior indicator you have to choose a time frame, which represents a peak or low point and should be somewhat significant. Following the beginning point, the first line will appear one period later, the next two, and so on. Fibonacci time zones effectively tell us that 13, 21, 55, 89, 144, 233... periods following a high or low, another high or low might occur.
Only time matters in time zones; pricing is irrelevant. As a result, time zones can represent minor highs and lows as well as important ones. It is possible to confirm transactions or conduct research using the Fibonacci Zone indicator.
Other useful momentum indicators for NinjaTrader and more!
With the Fibonacci Zone Superior Indicator download you are using one of the most reliable techincal analysis tool, but be sure to check out our other trend indicators:
TMA Bands Superior
The TMA computes an average using the sum of the SMA. This causes the plot to be steadier. The SMA period can be adjusted in the indicator settings. Our TMA Bands indicator also plots to an upper and lower band. These bands are calculated using Average True Range (ATR) and aid in identifying significant changes in market direction.
QQE Superior
The Quantitative Qualitative Estimation (QQE) indicator is based on Wilders' famous Relative Strength Index (RSI). The QQE Indicator is typically created by smoothing a 14-period RSI with a 5-period EMA. The QQE is smoothed further with a 27-period EMA before being multiplied by 4.236, one of the most commonly used percentage ratios based on the Fibonacci sequence. With the QQE signals, you can determine trend shifts within the chart and then decide whether to buy or sell. Furthermore, it detects current market overbought and oversold conditions.
DEVSIDE TRADING: DOWNLOAD THE FIBONACCI ZONE SUPERIOR INDICATOR FOR NINJATRADER AND MORE!
Add the Fibonacci Zone Superior to your shopping cart to receive all of its benefits, including trend changes and alerts. You can choose one of our many secure payment options after entering the necessary information during checkout.
We will then send you a confirmation email with an activation code, allowing you to securely download the Fibonacci Zone Superior Indicator. Interested? Frequently combined with our Superior Stochastic Oscillator and MA Crossover.
DEVSIDE TRADING SUPPORT
Do you need assistance activating your purchased downloads or utilizing the Fibonacci Zone Superior Indicator with our App? Check out our helpful activating your product guide!
Do you want more? Check our collection of Ninja Trader 8 Indicators for all your trading needs! We also have an exciting NinjaTrader App and an e-mail share service. Of course, we will only collect your personal information if you freely give it to us, such as when ordering an indicator, opening a membership account, or subscribing to our newsletter.
Are there any remaining questions? Please use our contact form to get in touch with us, or you can chat with us directly!
Made in Germany


