WHAT IS THE FIBONACCI BOLLINGER SUPERIOR AND WHAT ARE THE PERKS OF DOWNLOADING THE INDICATOR?
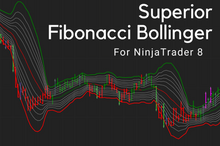
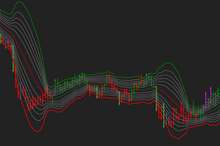
The Fibonacci Bollinger Indicator is based on the same principles as the standard Bollinger Bands®. The base line is a simple moving average. Bands are calculated using Welles Wilders smoothed average true range (ATR). Each band is a fibonacci ratio of the ATR away from the base line.
It consists of the upper and lower bands on either side of the Simple Moving Average (SMA). Each range shows two standard deviations from the SMA in the market. The Fibonacci Bollinger strategy can be used to highlight support and resistance areas.
The Fibonacci Bollinger Superior is one of our favorite trend indicators and therefore featured in our NinjaTrader 8 Market Trading Indicators!
OUR SUPERIOR FIBONACCI BOLLINGER SUPERIOR: GREAT FEATURES FOR EASY TRADING
Download the Fibonacci Bollinger Superior Indicator by Devside Trading for NinjaTrader 8 today!
✅ Features
-
✅ Based on proven technical analysis of charts
-
✅ Shows trend reversals
-
✅ Suitable for all types of traders and investors
-
✅ Easily set up
-
✅ Full customization including colours
-
✅ Fully compatible with NinjaTrader 8
-
✅ Premium features: Arrow Markers, Sound Alerts, Signals
-
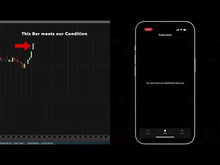
✅ Drawing arrow marker when the price crosses one of the Support or Resistance lines
-
✅ Cross Region signals for the following states:
-
Price above 1 Band = 7
-
Price above 0.764 Band = 6
-
Price above 0.618 Band = 5
-
Price above 0.5 Band = 4
-
Price above 0.382 Band = 3
-
Price above 0.236 Band = 2
-
Price above Middle Band = 1
-
Price on Middle Band = 0
-
Price below Middle Band = -1
-
Price below -0.236 Band = -2
-
Price below -0.382 Band = -3
-
Price below -0.5 Band = -4
-
Price below -0.618 Band = -5
-
Price below -0.764 Band = -6
-
Price below -1 Band = -7
-
-
✅ Period: sets the period for the SMA
-
✅ Number of standard deviations: sets the number of standard deviations used by the Premium Fibonacci Bollinger
-
✅ Sound Alerts: Set sound alerts for upper cross, lower cross, inside cross
-
✅ Email Alerts: Receive alerts via Mail for upper cross, lower cross, inside cross
-
✅ PopUp Alerts: Display alerts as popup window for upper cross, lower cross, inside cross
-
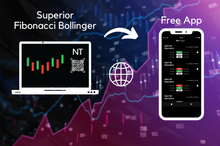
✅ Push Alerts: Receive alerts for upper cross, lower cross and inside cross directly on your phone with our free Trado Alerts app available on the App Store and Play Store.
-
✅ Plot smoothing: You can also select an additional moving average for smoothing of the Bollinger Bands
-
✅ Bar coloring: Enables bar coloring for down and up trends

OUR SUPERIOR TWO LEGGED PULLBACK: GREAT FEATURES FOR EASY TRADING
The Fibonacci Bollinger Superior Indicator can provide useful information about market trends. Volatility is caused by strong trends, which can be seen as a widening or narrowing of the Bollinger Bands. Fibonacci Bollinger bands, like Bollinger Bands, have a moving average as the center band. Fibonacci bands, on the other hand, have six upper and six lower bands, whereas Bollinger bands have only one upper and one lower band.
The Fibonacci Bollinger bands are created by multiplying the ATR by each of the Fibonacci factors. The Average True Range (ATR) is a price volatility indicator. The upper and lower bands will respond swiftly to price changes, taking into account periods of high and low volatility, when ATR is applied to a simple moving average.
For more in-depth analysis check out our Volume Delta Profile indicator, which is one of our favorite volume indicators. Or combine it with one of our momentum indicators, for example the Stochastic Oscillator Superior indicator to get a more accurate reading on the time frame of a change in the market price. With this combination you can evaluate the strength of a bullish or bearish market.
OTHER USEFUL TREND INDICATORS FOR NINJATRADER AND MORE!
With the Fibonacci Bollinger Superior Indicator download you are using one of the most reliable techincal analysis tool, but be sure to check out our other trend indicators:
Over a given time period, the Heikin Ashi Moving Average (HAMA) plots a completely new set of bars. The two types of bars are uptrend bars and downtrend bars. You can decide whether to buy or sell using the Heikin Ashi Candles' ability to show a clear trend shift.
The Fibonacci Zone Superior Indicator is a Donchain Channel calculated by taking the highest high and lowest low of the previous n periods. It displays four Fibonacci lines, including the High and Low Border Lines. Three of the five subsequent zones were also colored in suggestive colors. Fibonacci zones can serve as both supports and resistance.
Qualitative Quantitative Estimation Superior
Wilders' famous Relative Strength Index serves as the foundation for the Quantitative Qualitative Estimation (QQE) indicator (RSI). To generate the QQE plot, the QQE Indicator typically employs a 14-period RSI that is smoothed with a 5-period EMA. The QQE is smoothed further with a 27-period EMA before being multiplied by 4.236, one of the most commonly used percentage ratios based on the Fibonacci sequence.
EXPERIENCE THE NINJATRADER FIBONACCI BOLLINGER SUPERIOR INDICATOR AND OTHERS BY DEVSIDE TRADING!
Add the Fibonacci Bollinger Superior Indicator to your basket to receive all perks including as notifications and trend changes. After entering the required information at the checkout, you may select one of our secure payment options.
Next, we will send you a confirmation message via email with an activation code, so you can safely download the Fibonacci Bollinger Superior Indicator. Interested? Often used in combination with our Ichimoku Cloud Superior and FREE Stochastic Momentum Index.
DEVSIDE TRADING SUPPORT
Need Help activating your purchased downloads or using Fibonacci Bollinger Superior Indicator with our App? Check out our helpful guide about activating your product! Want more?
We also have an exciting NinjaTrader App and e-mail share service. Of course, your personal details will only be collected if you freely disclose them to us, e.g. while ordering an indicator, opening a membership account or subscribing to our newsletter.
Any questions left? Feel free to contact us using our contact form or you can chat with us directly!
Made in Germany


